 ?
?
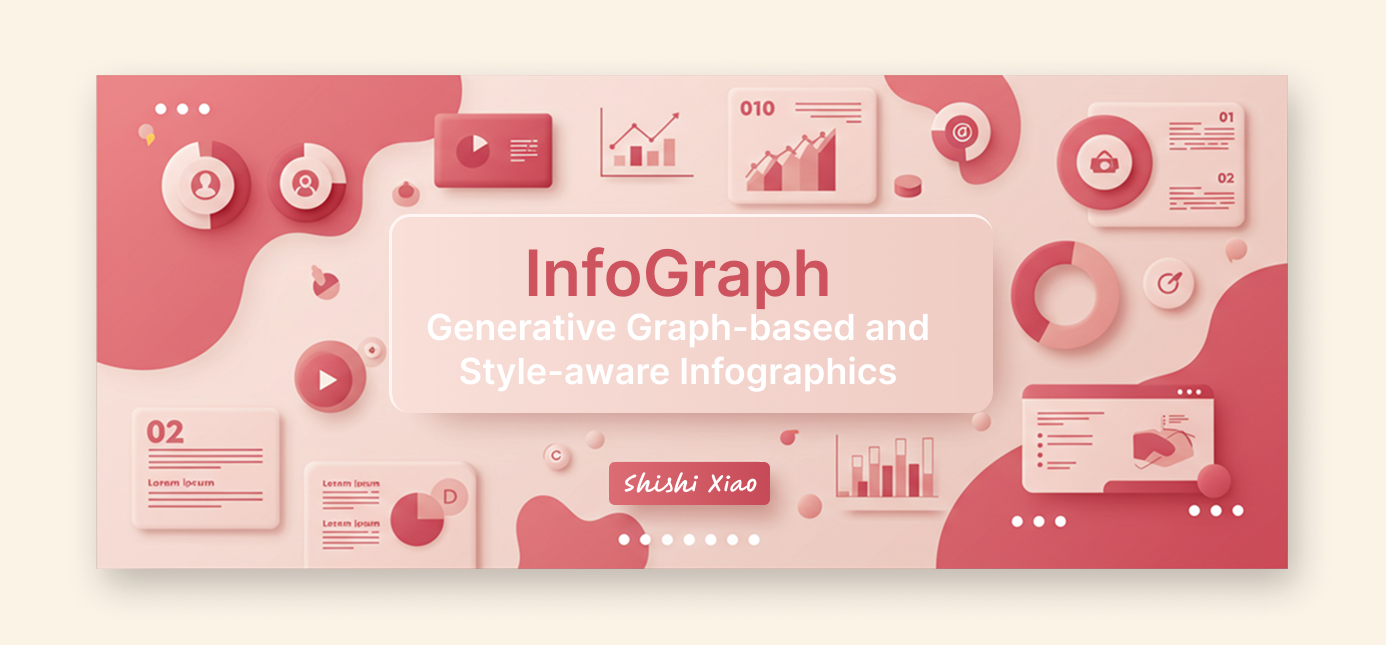
A form of visualization—
a geometric structure to visually communicate ideas.

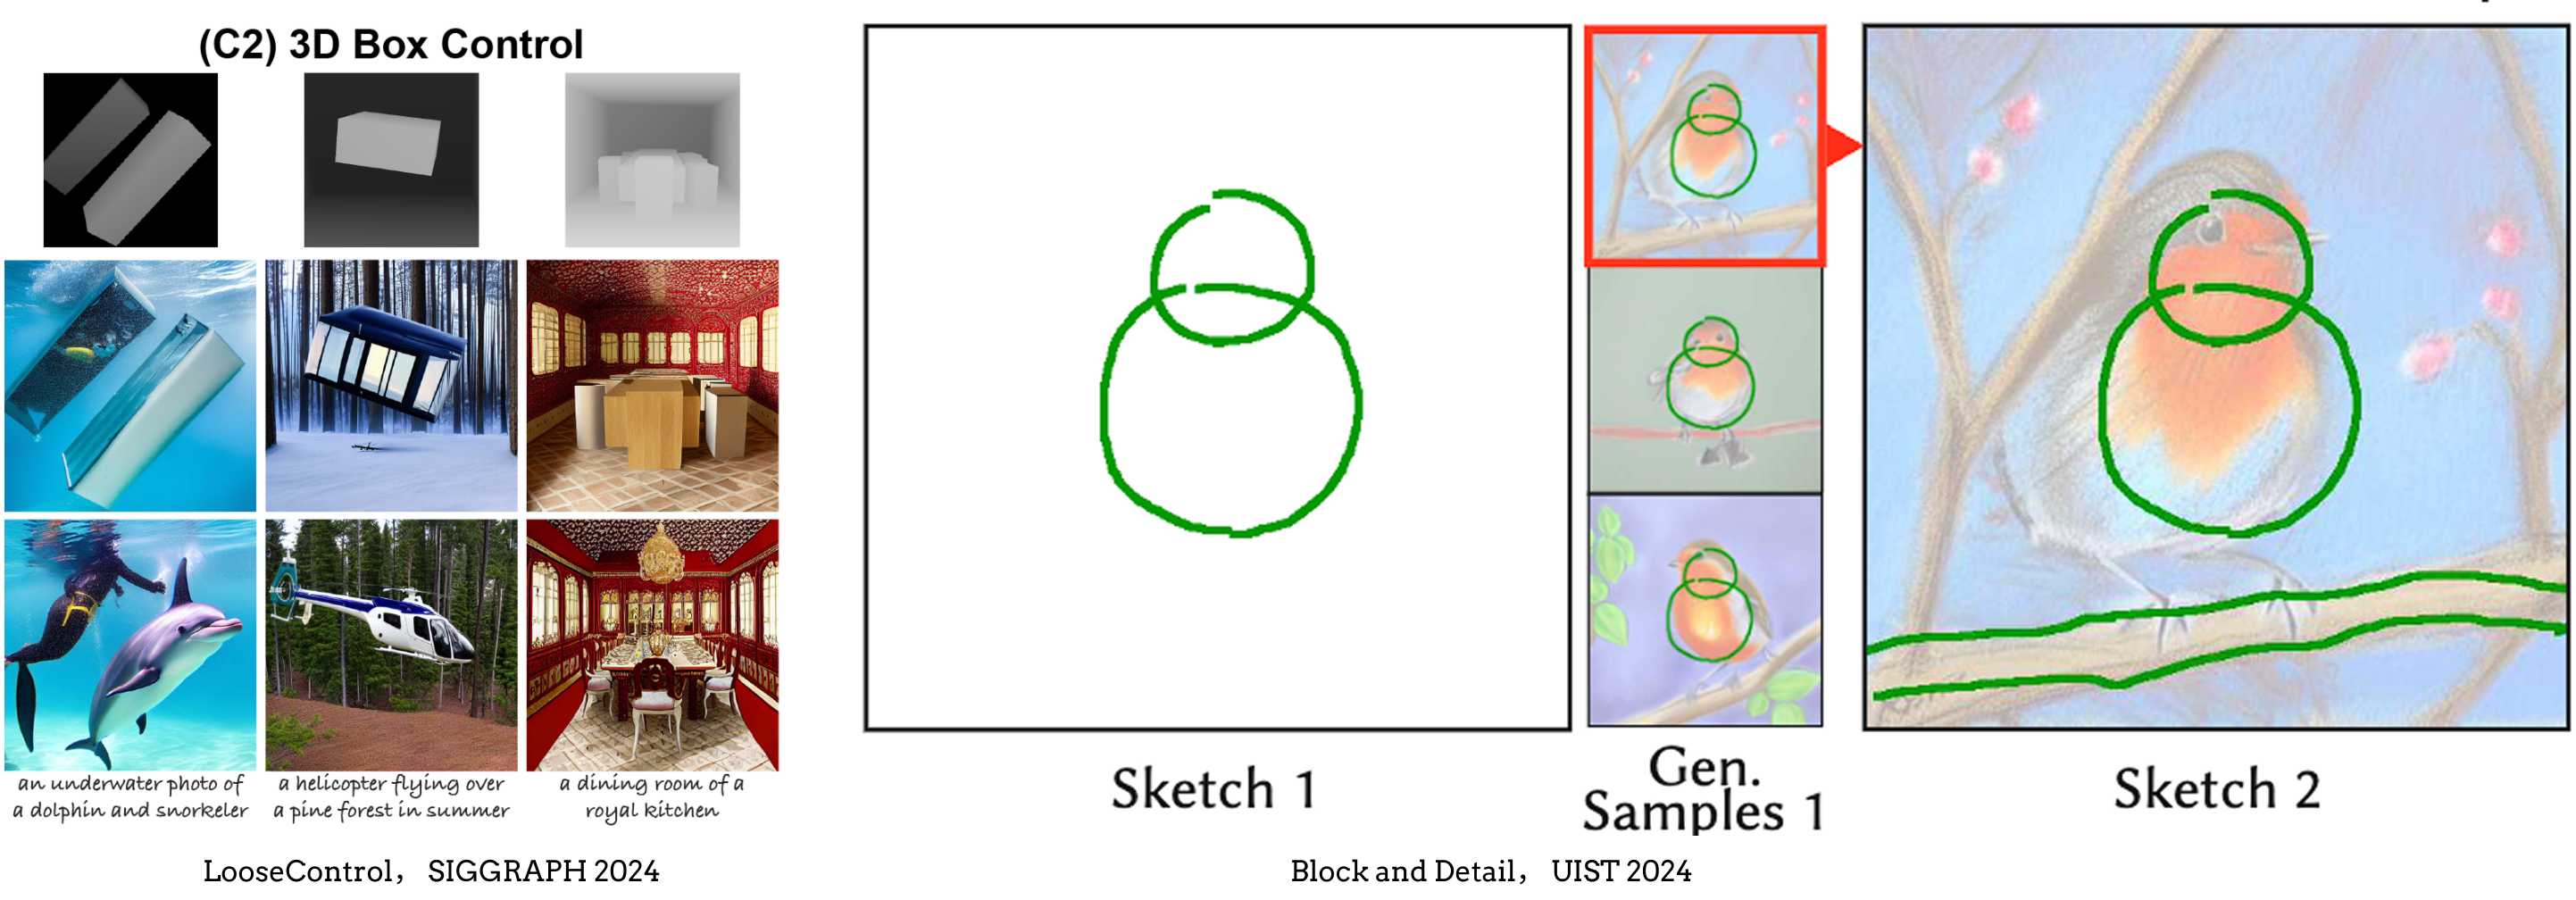
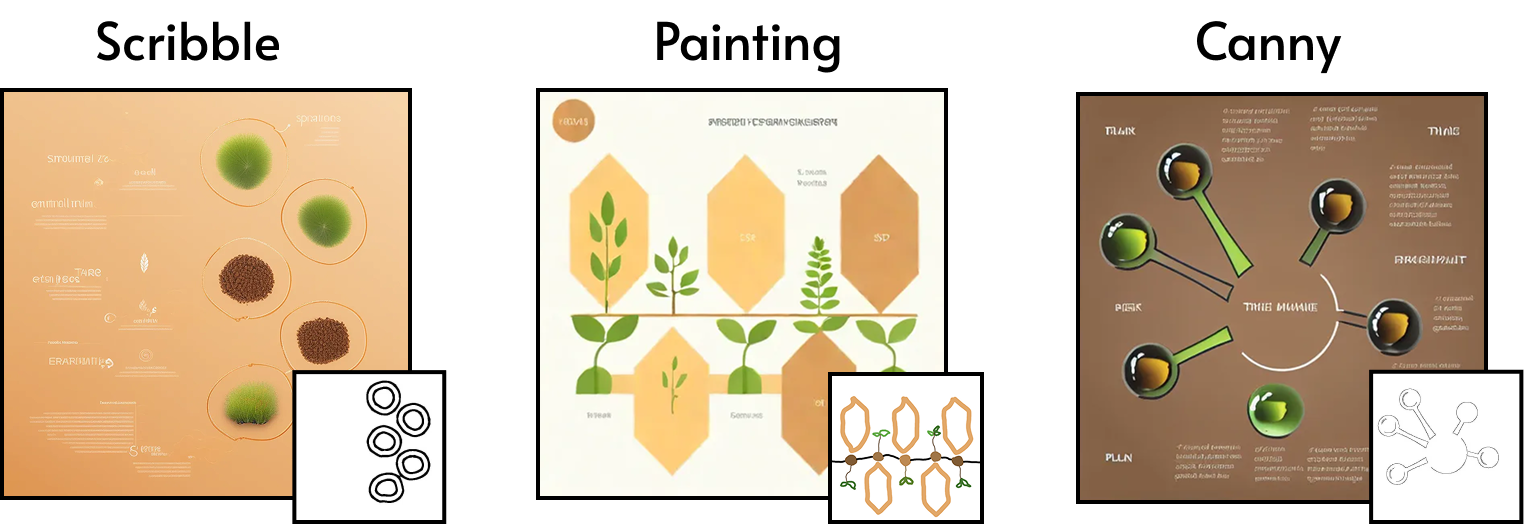
Recent generative approaches (e.g., diffusion-based models) offer very precise control, but often conform strictly and result in undesirable text and visual artifacts.
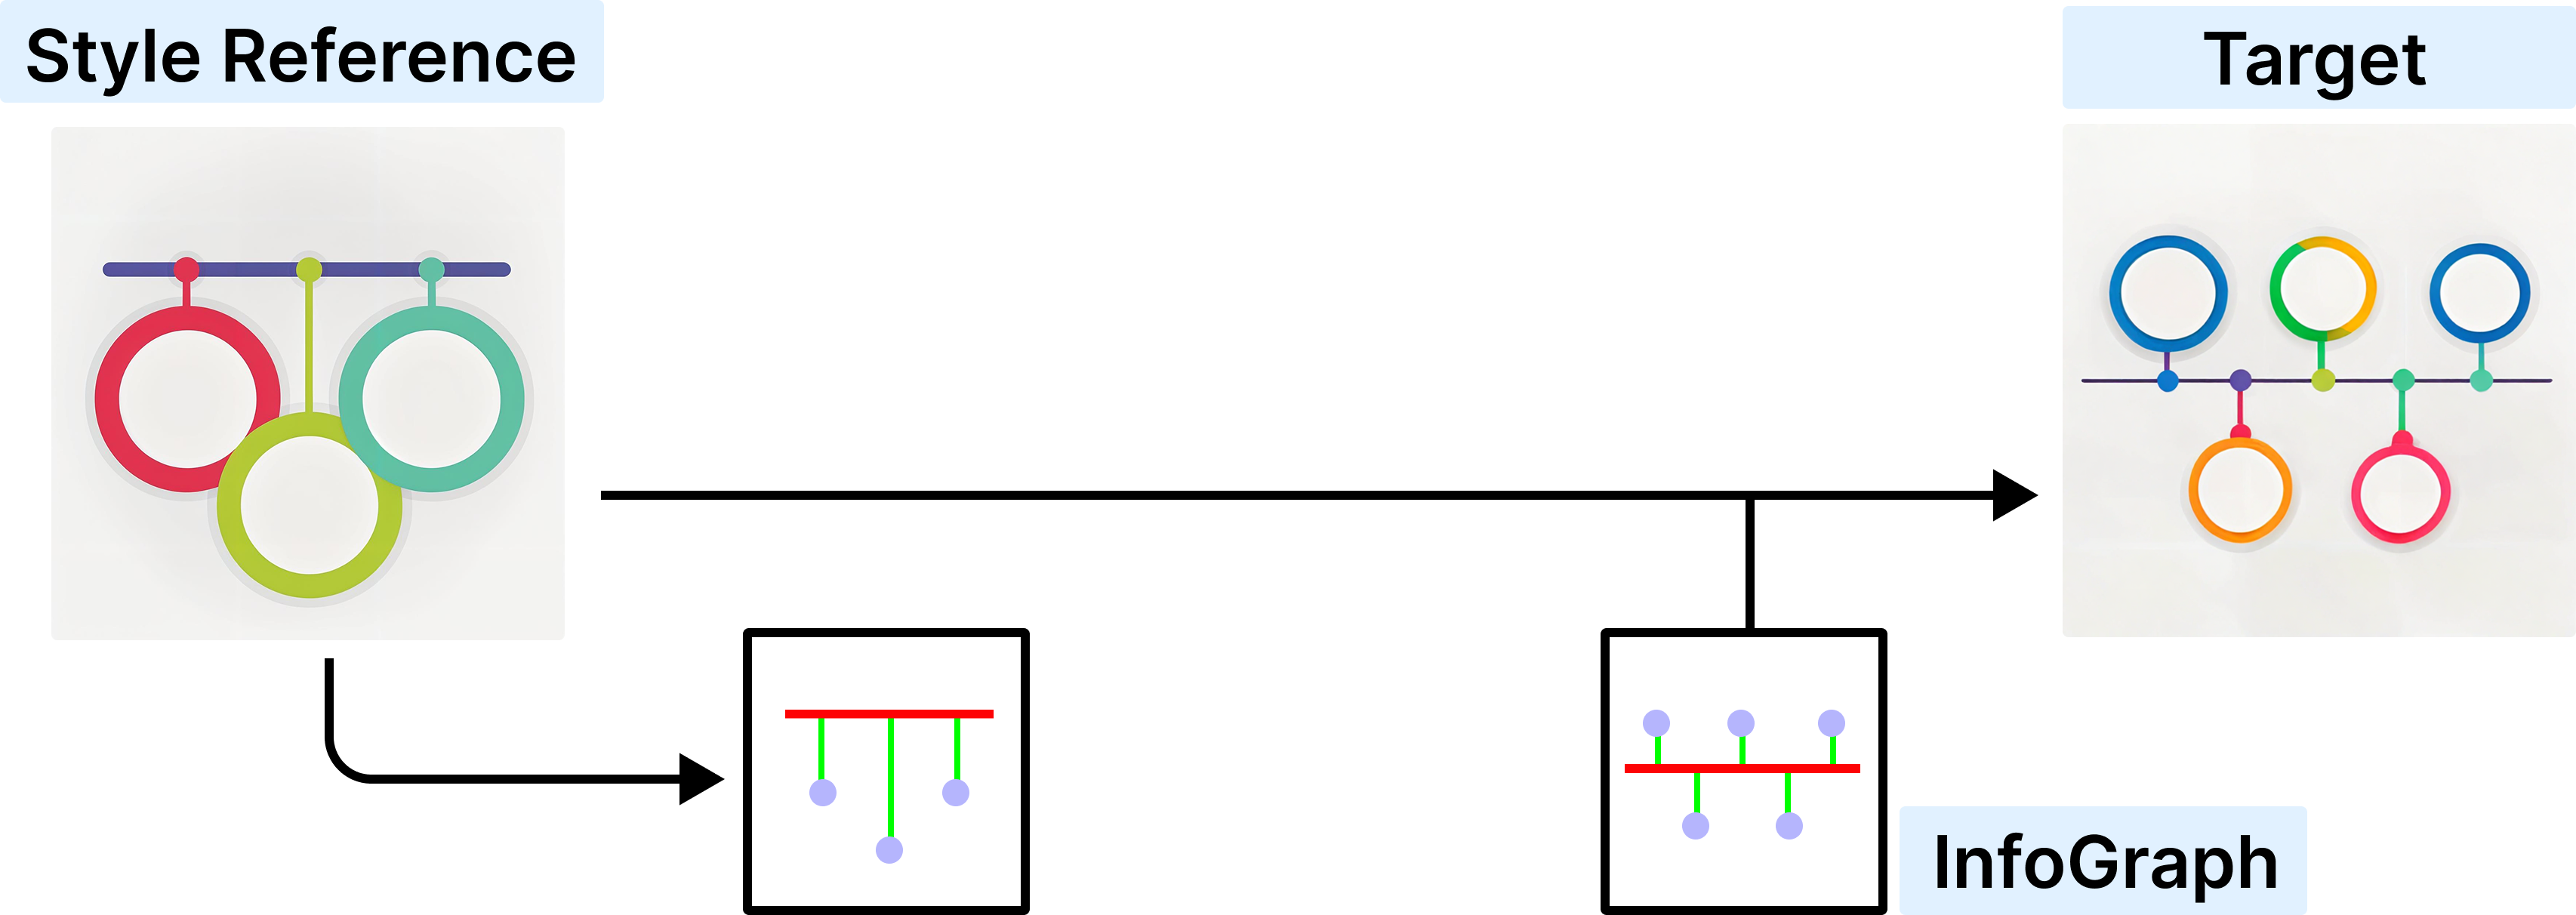
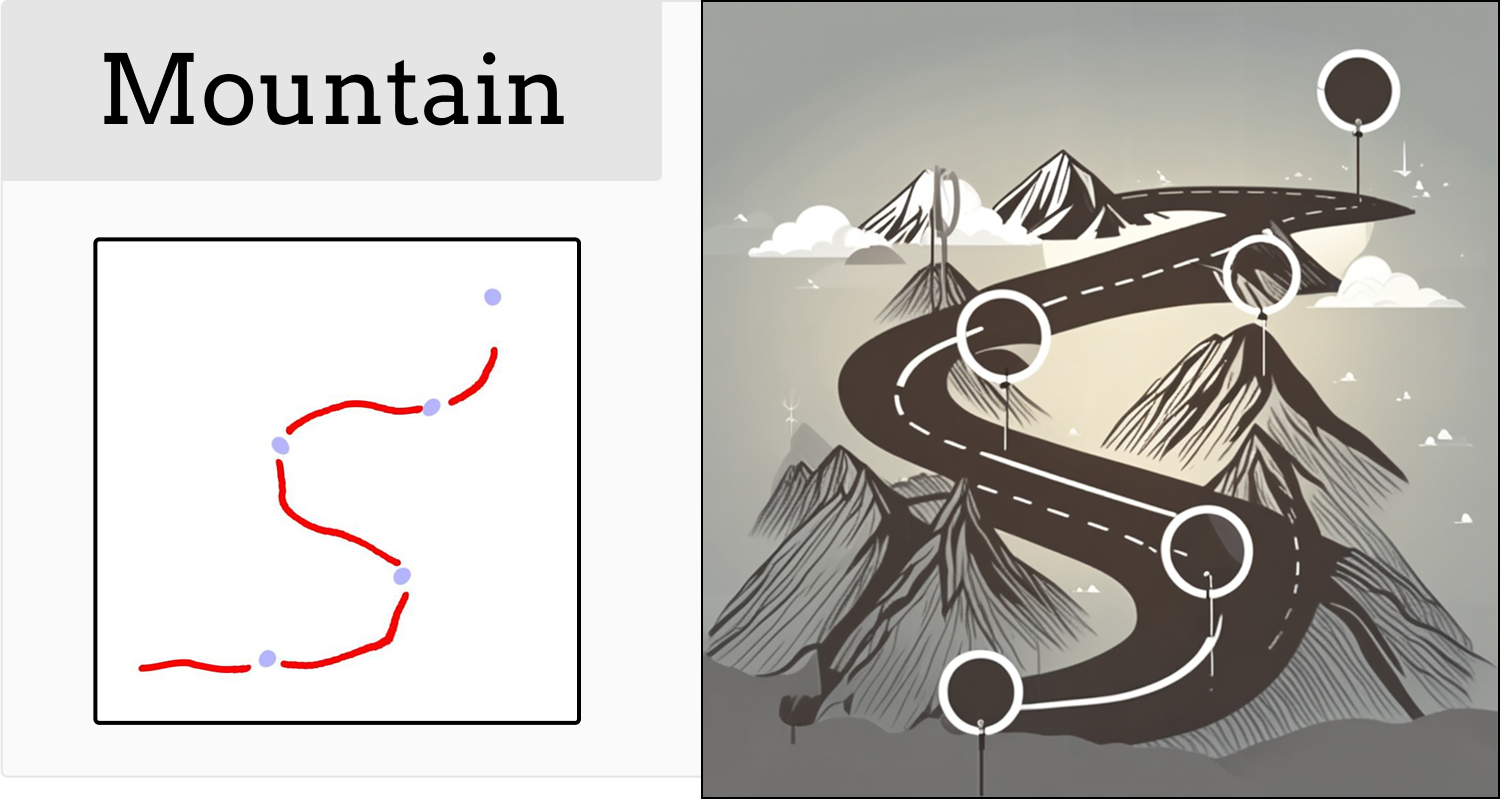
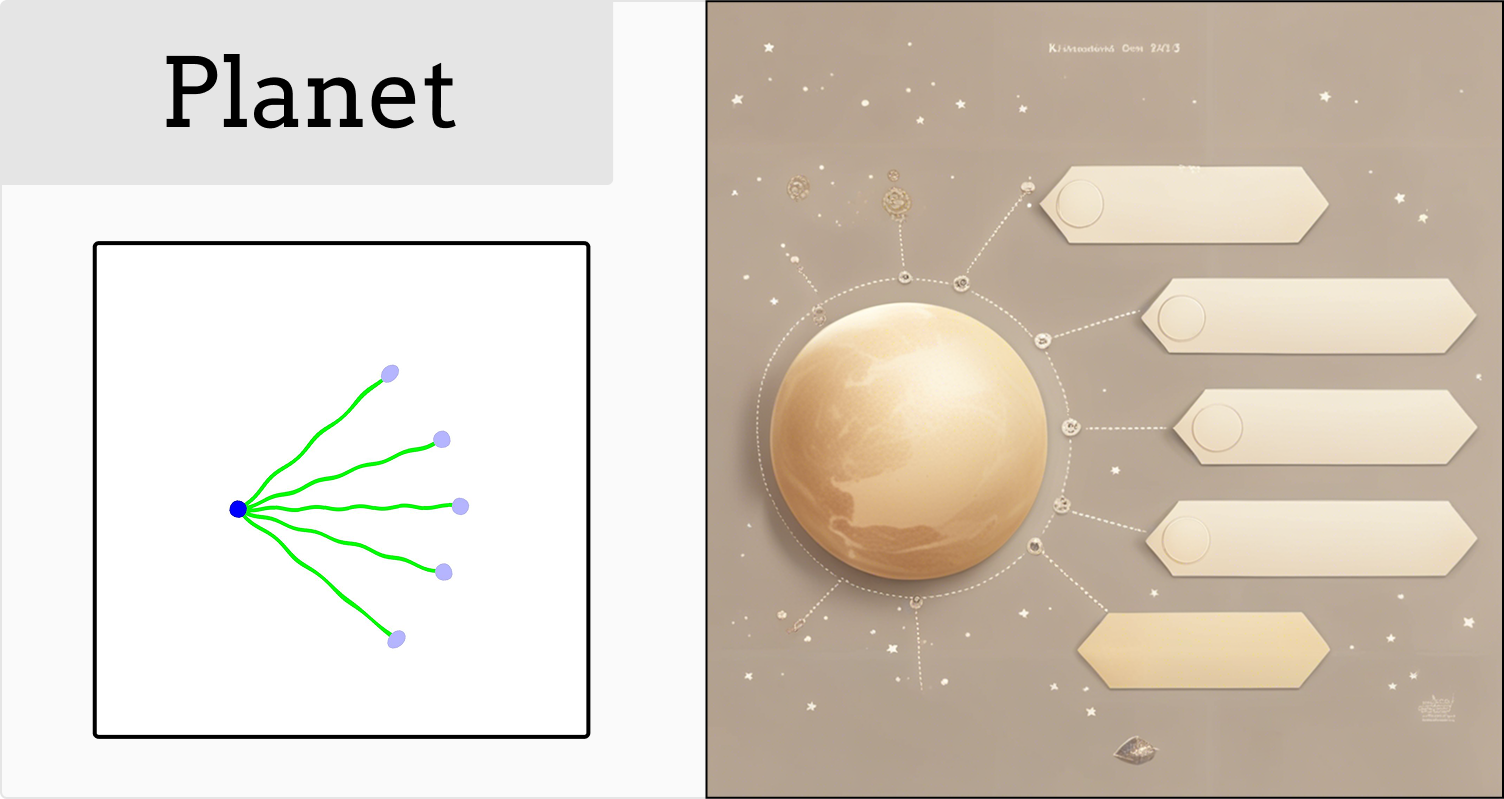
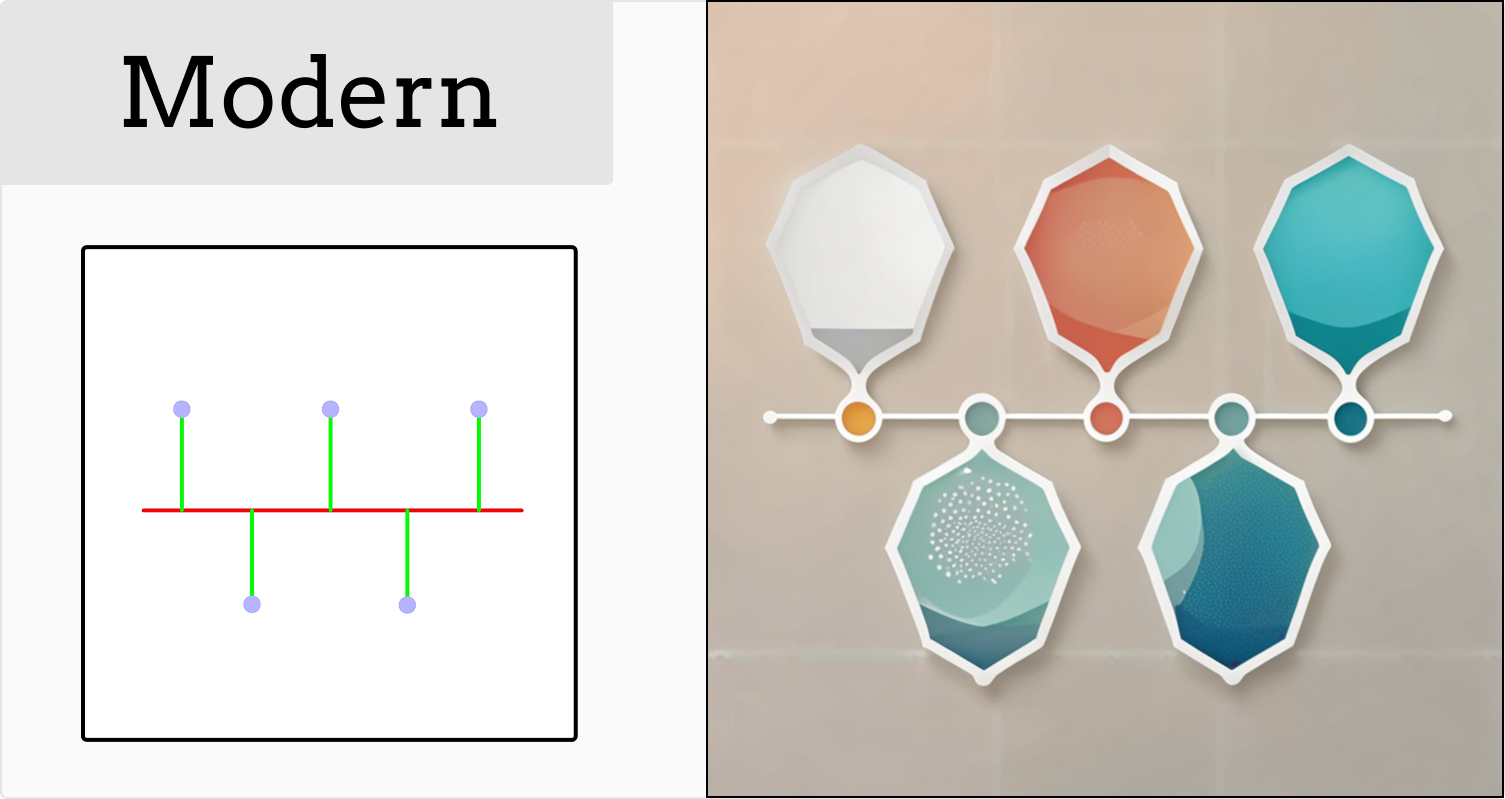
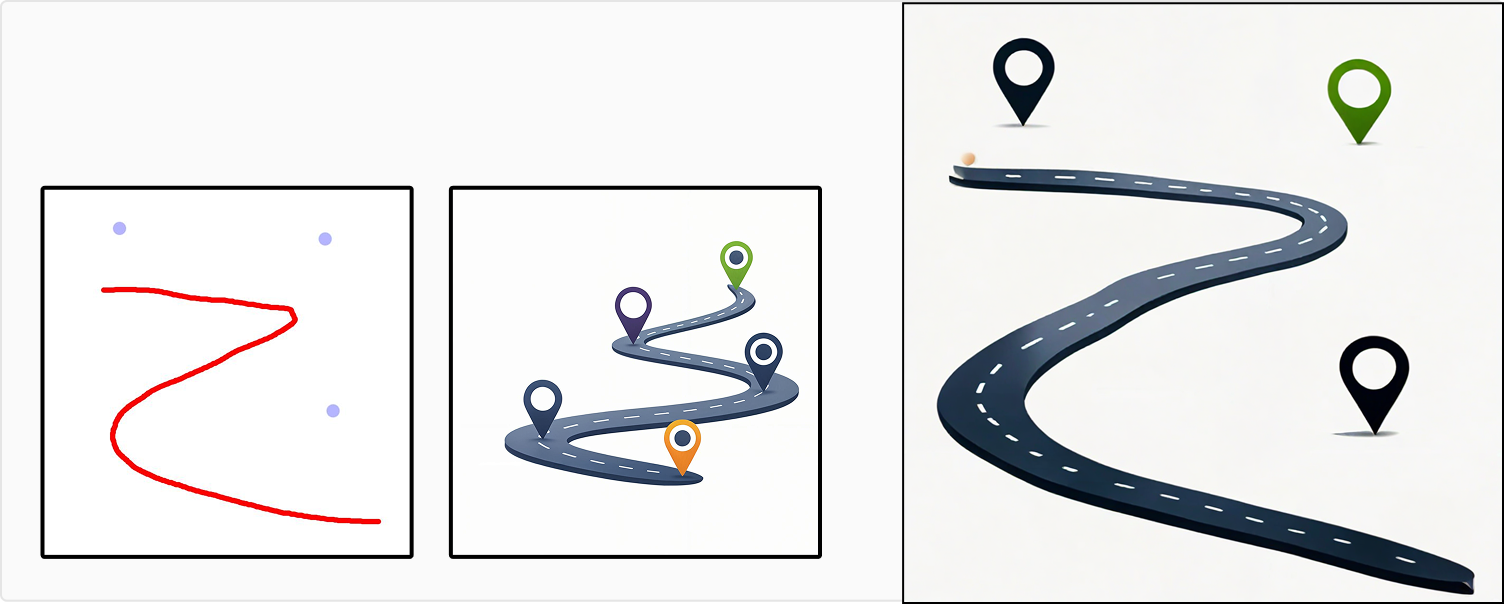
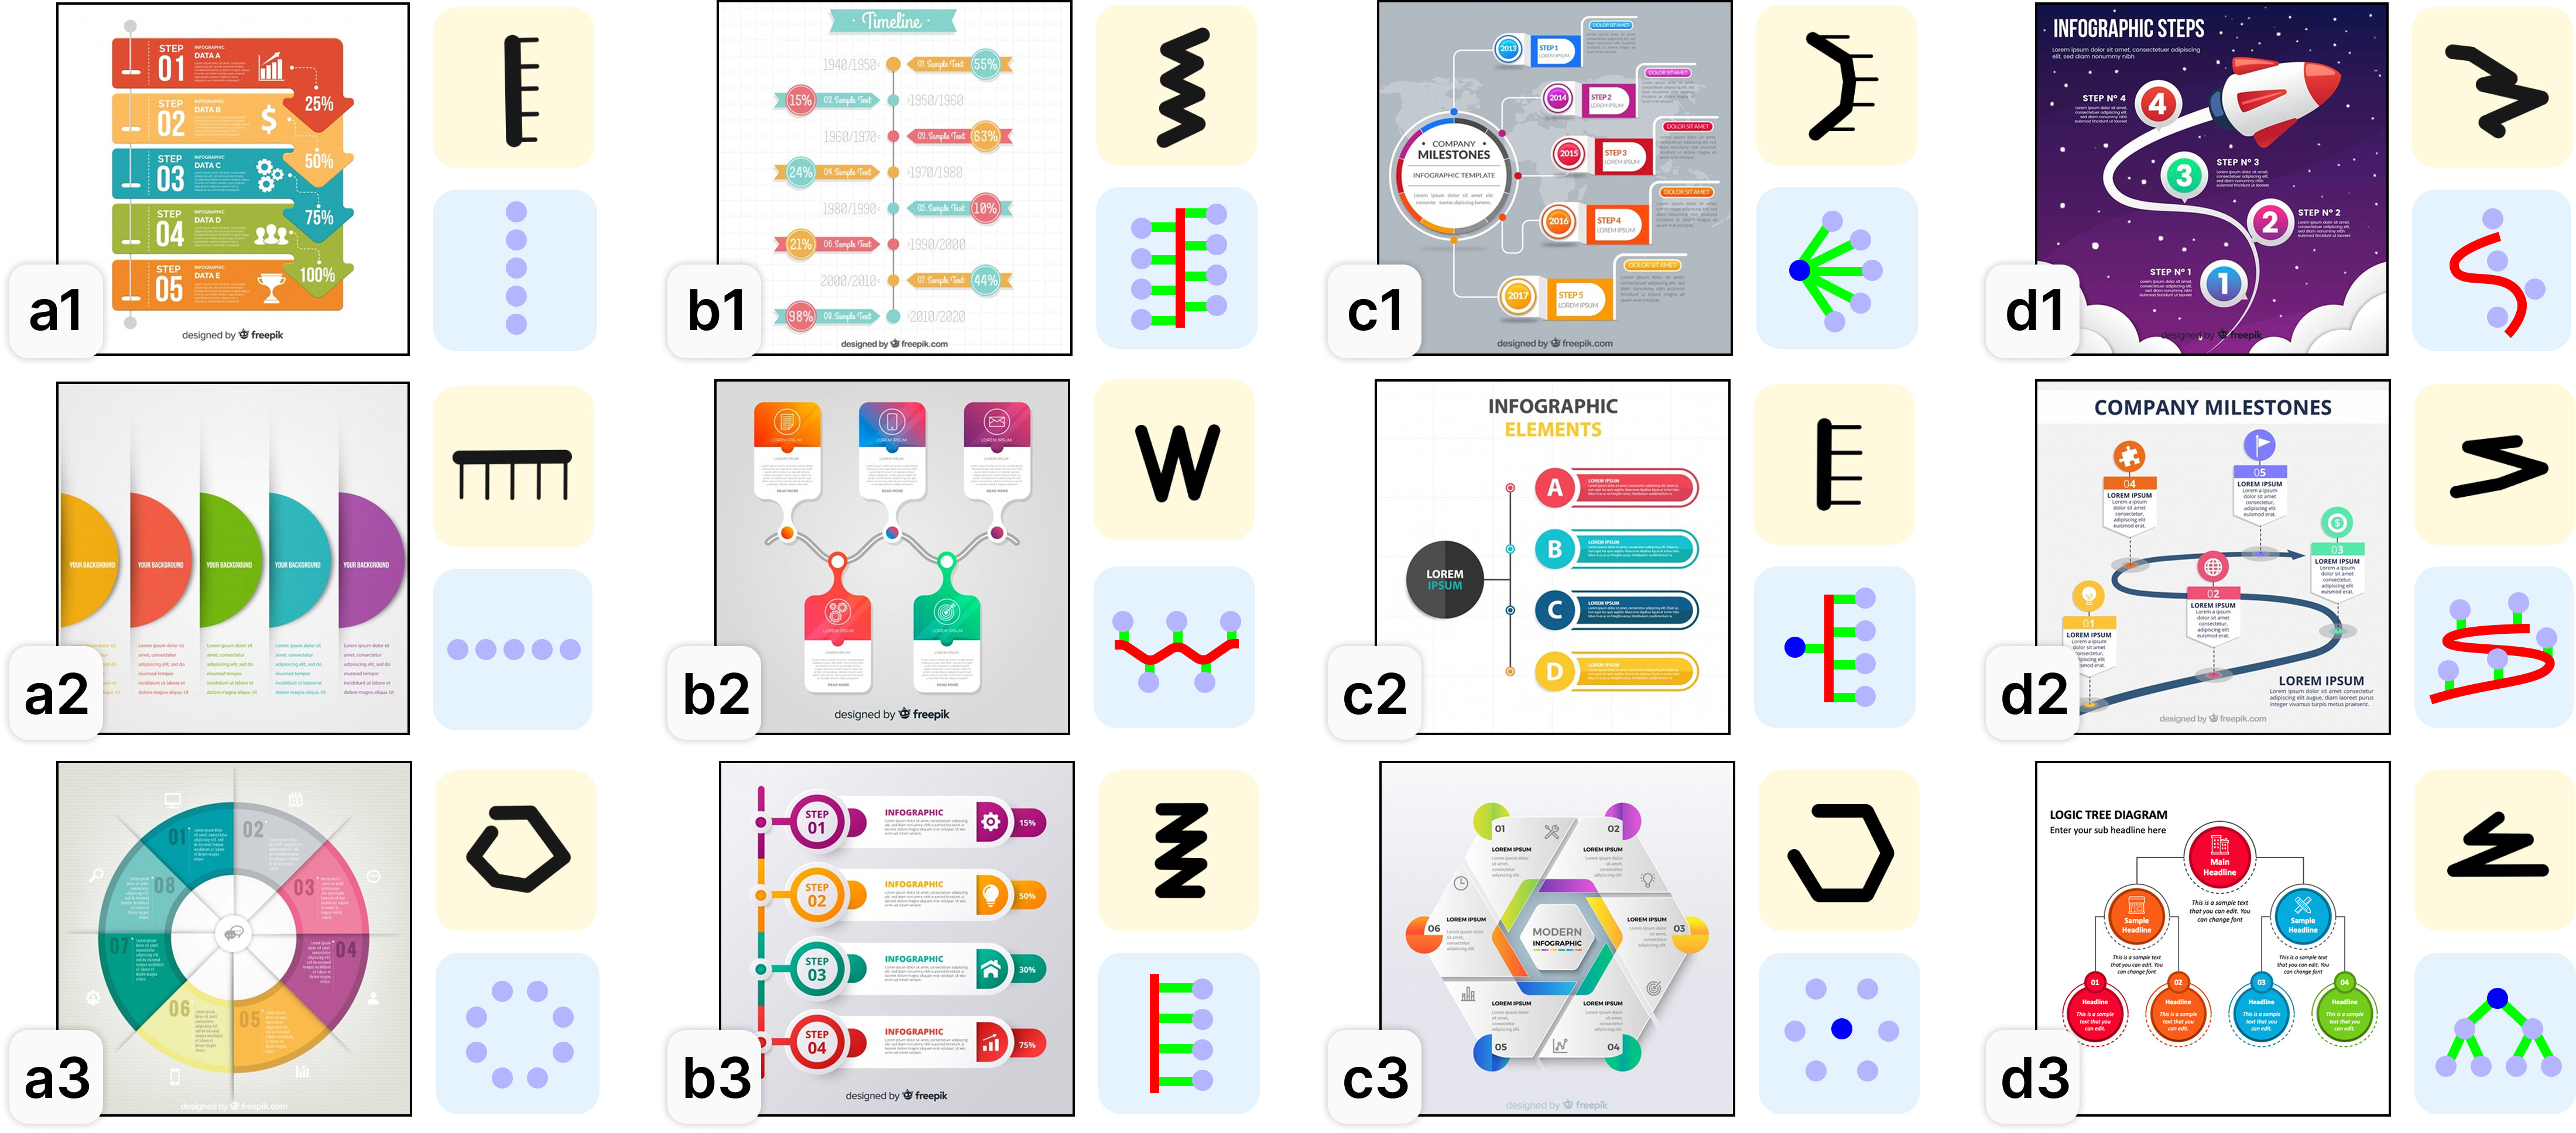
VIF[1] introduced an abstract representation using thick strokes to describe visual flow in infographic.
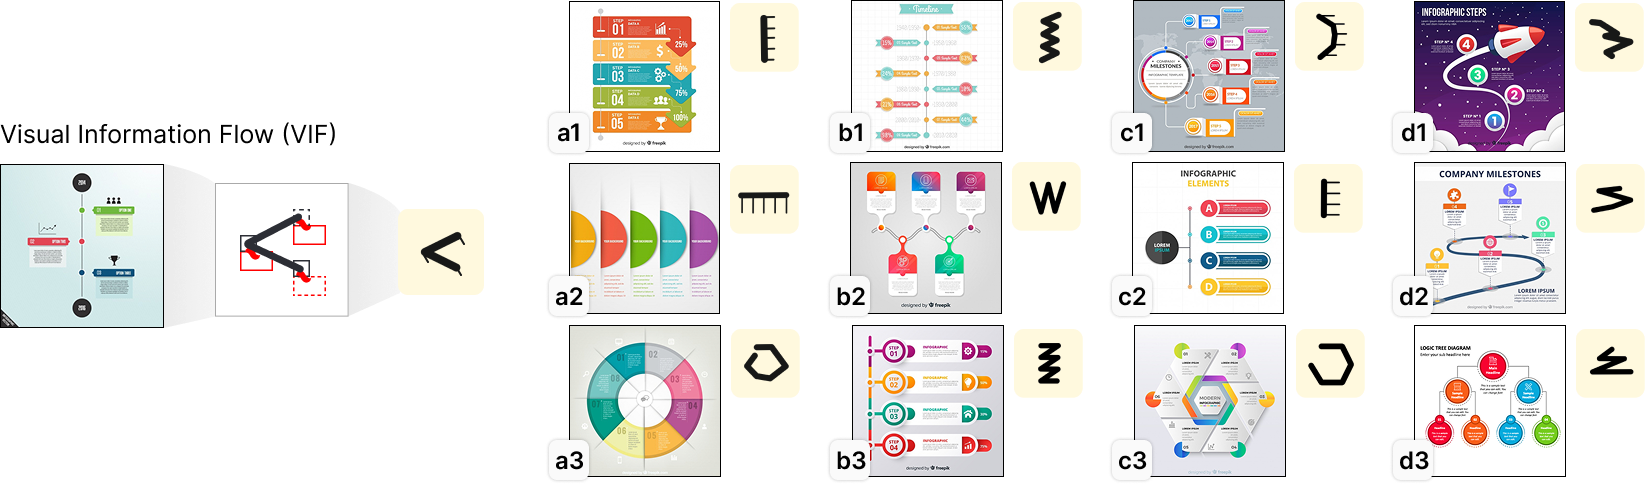

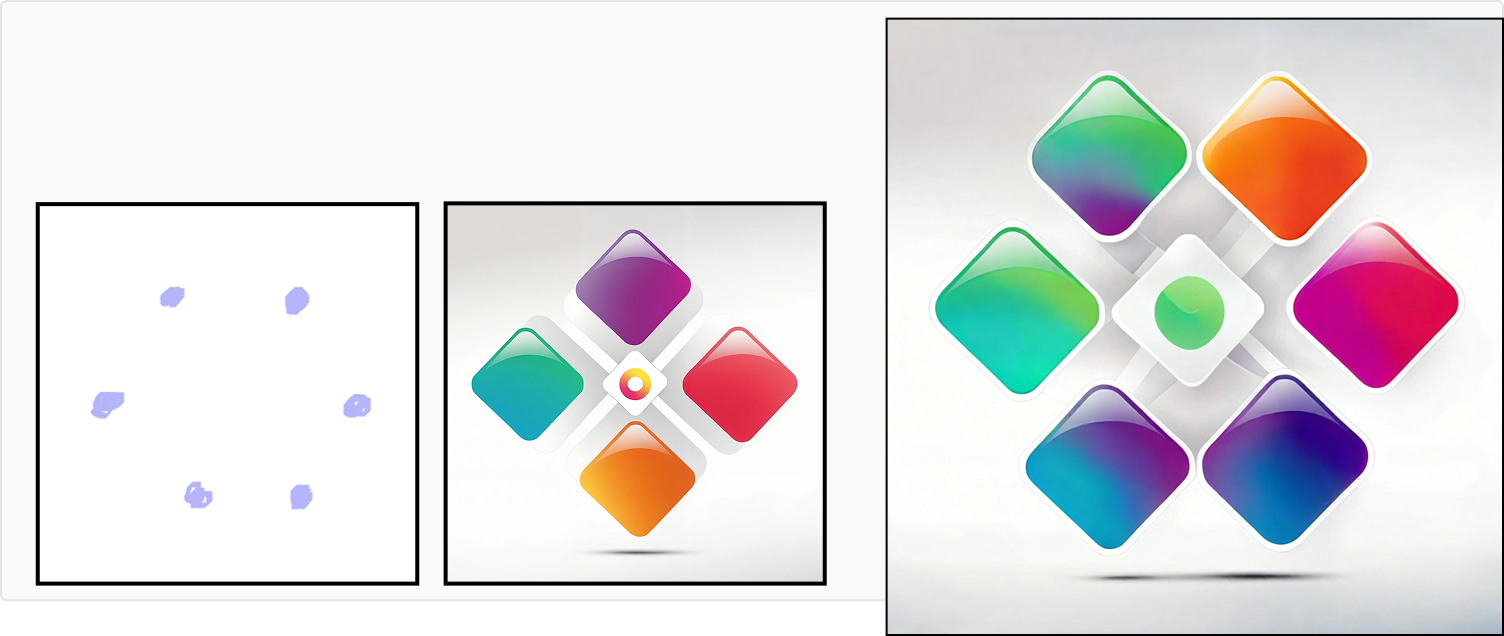
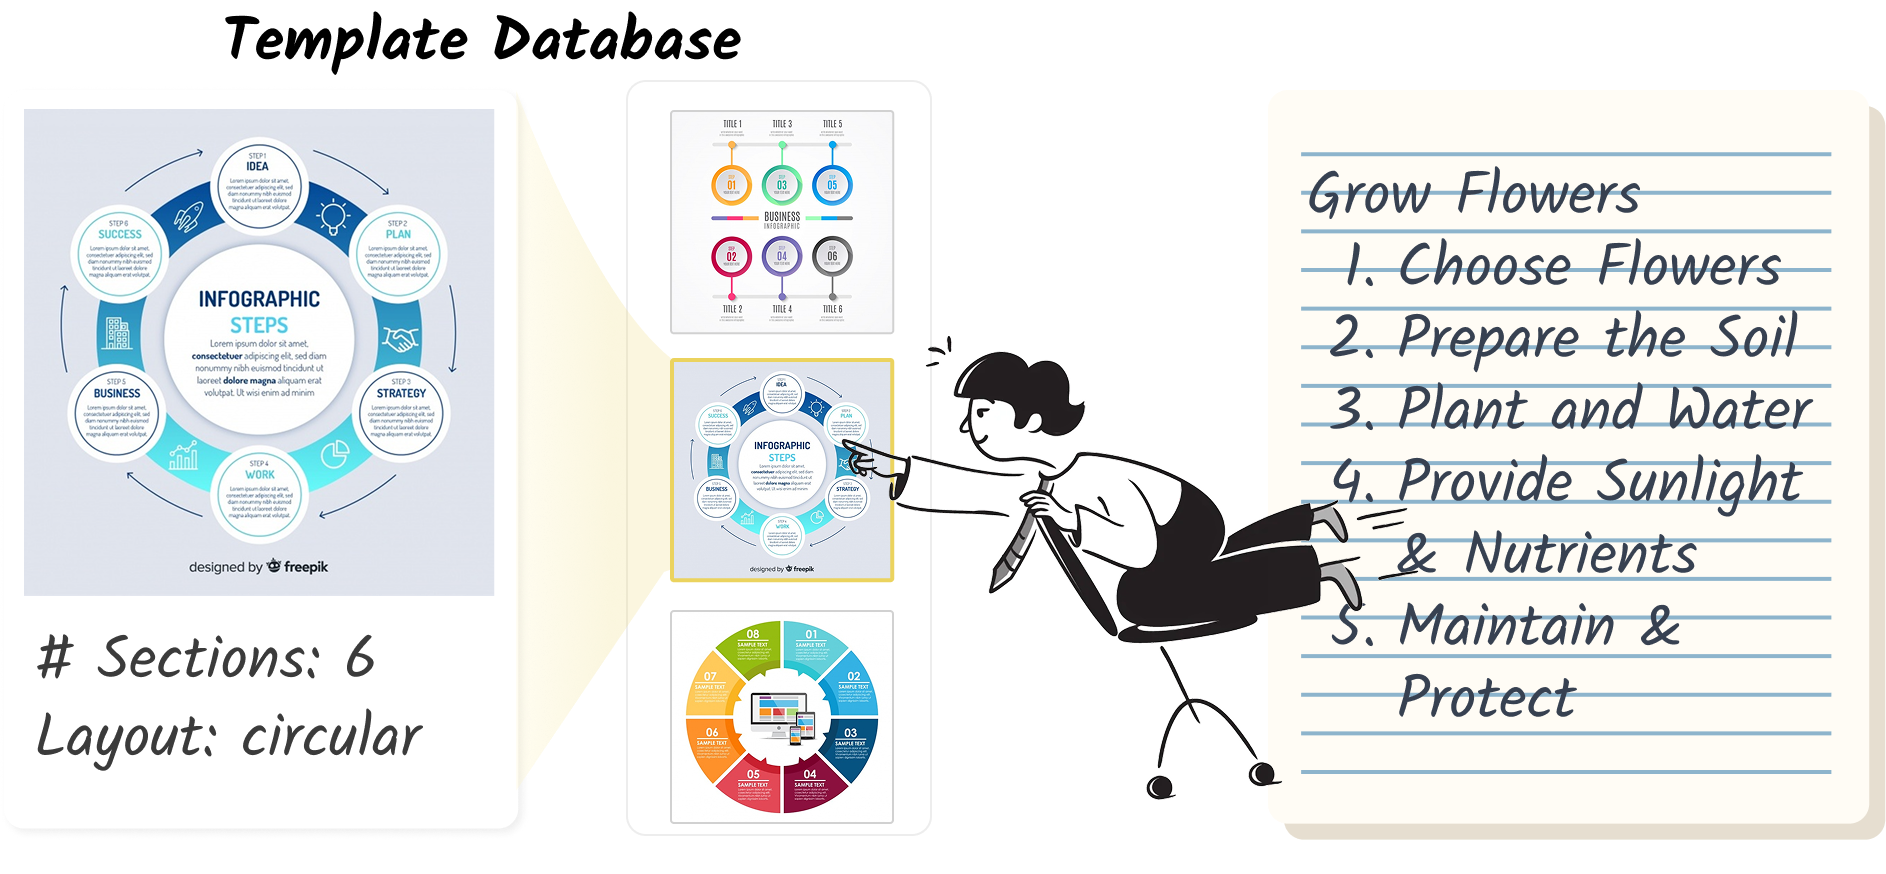
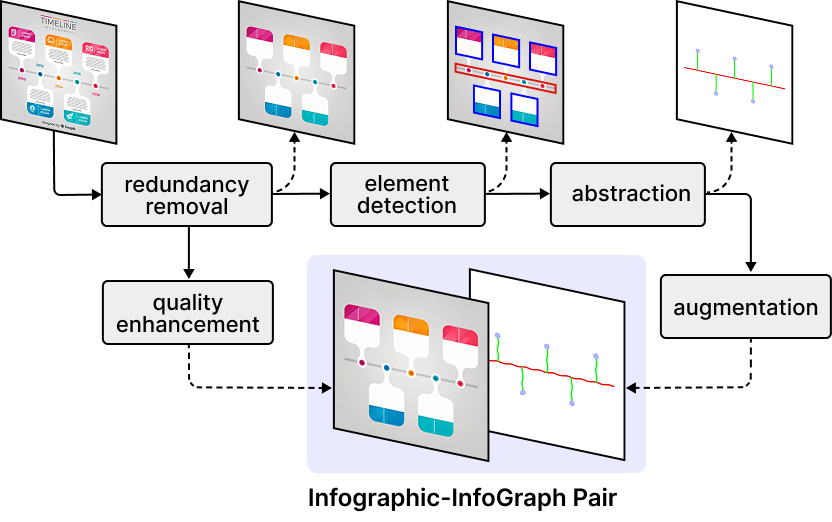
Capture the geometric and semantic layout of infographics through:
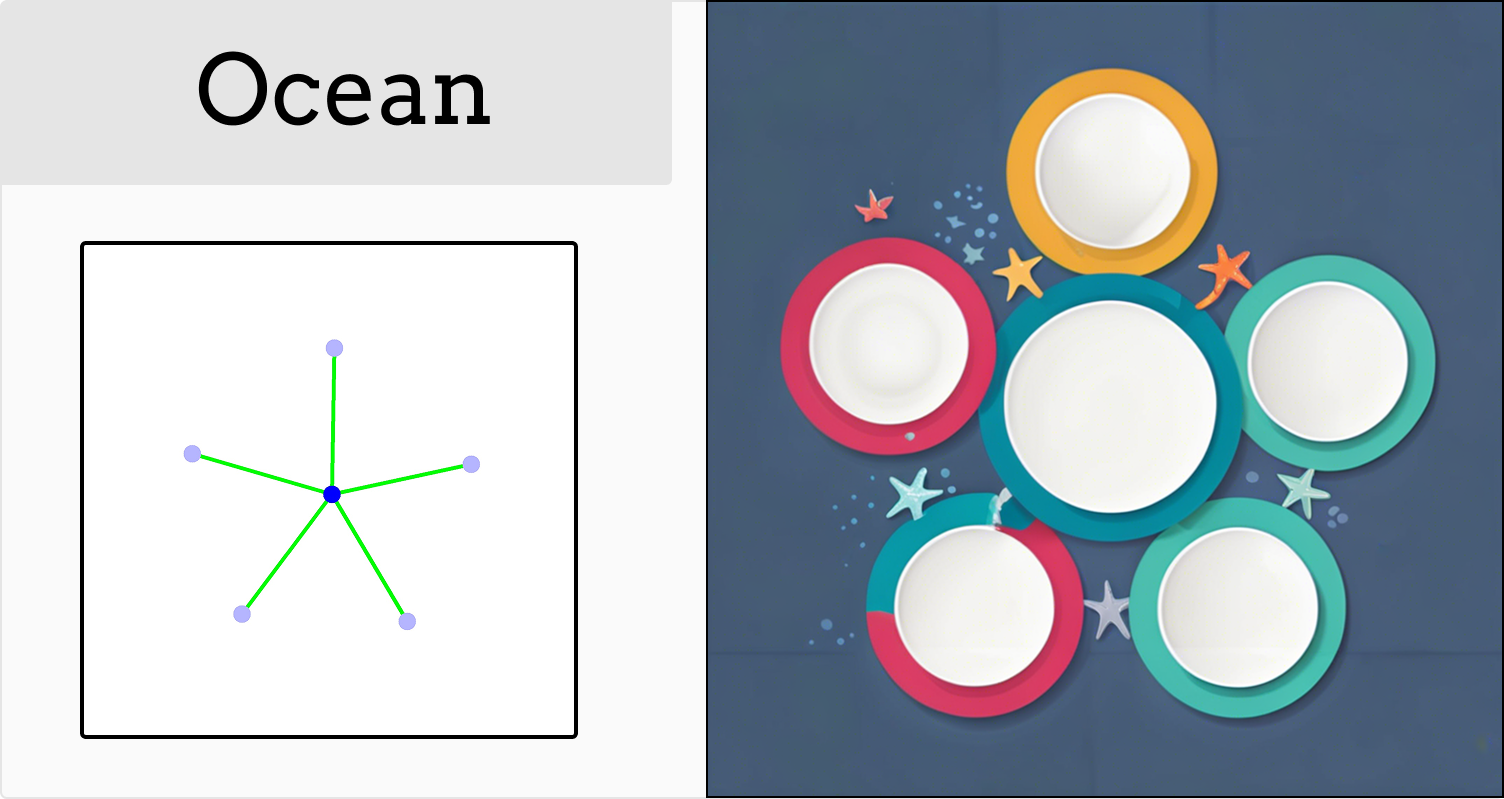
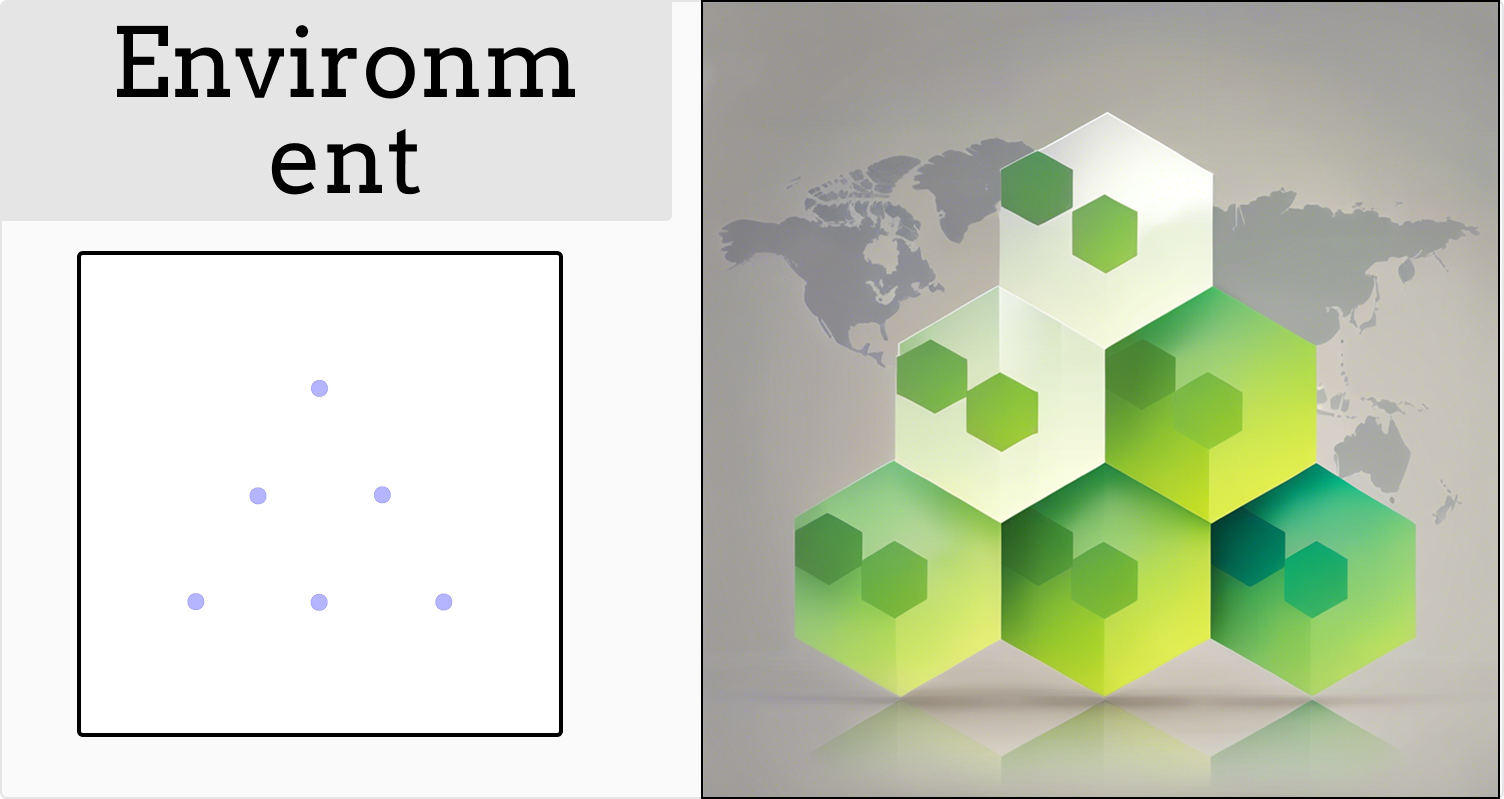
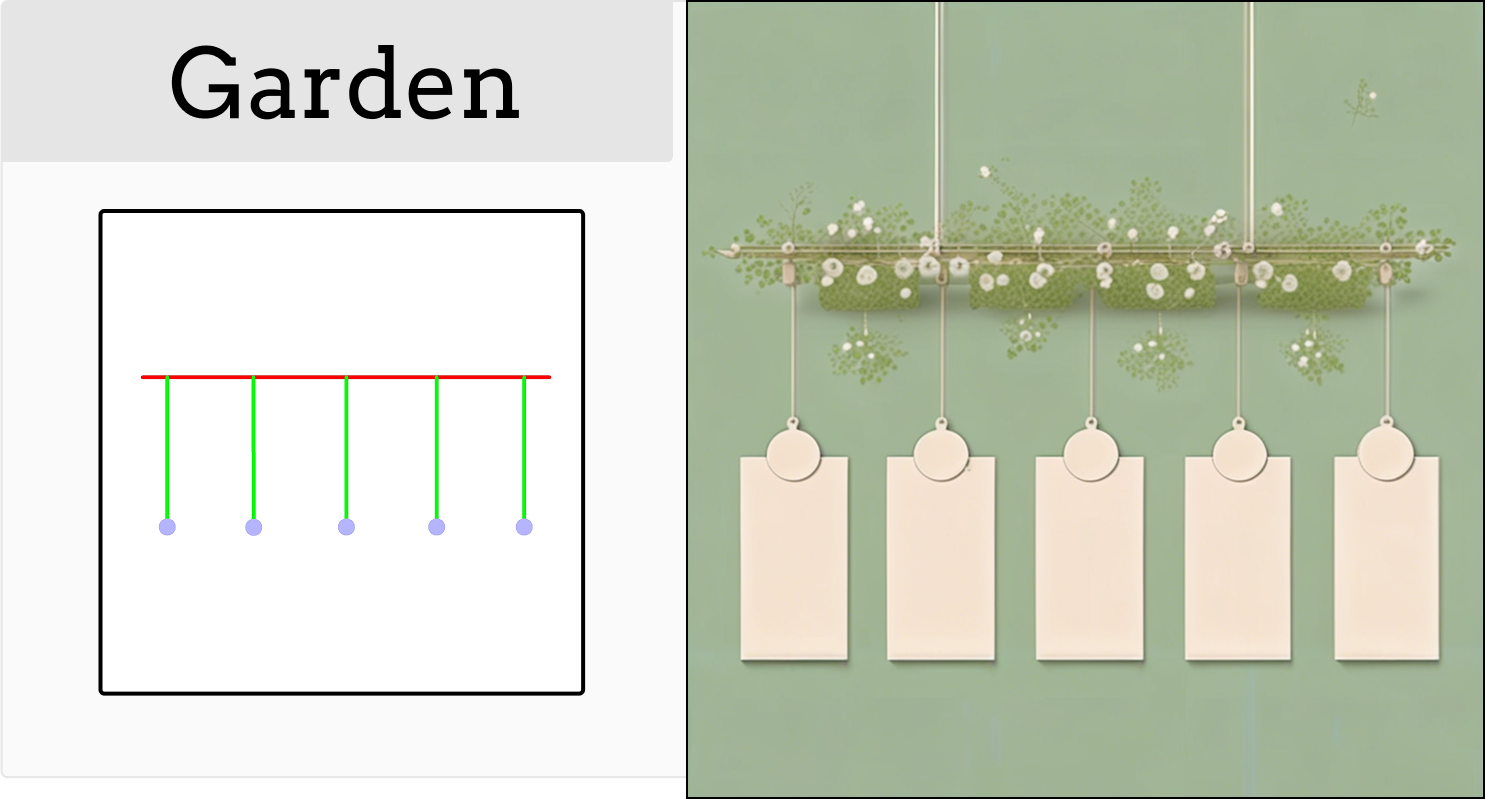
 Nodes
: Represent visual elements
Nodes
: Represent visual elements
 Backbone: Primary flow that connects information
 Branch: Connect node and backbone
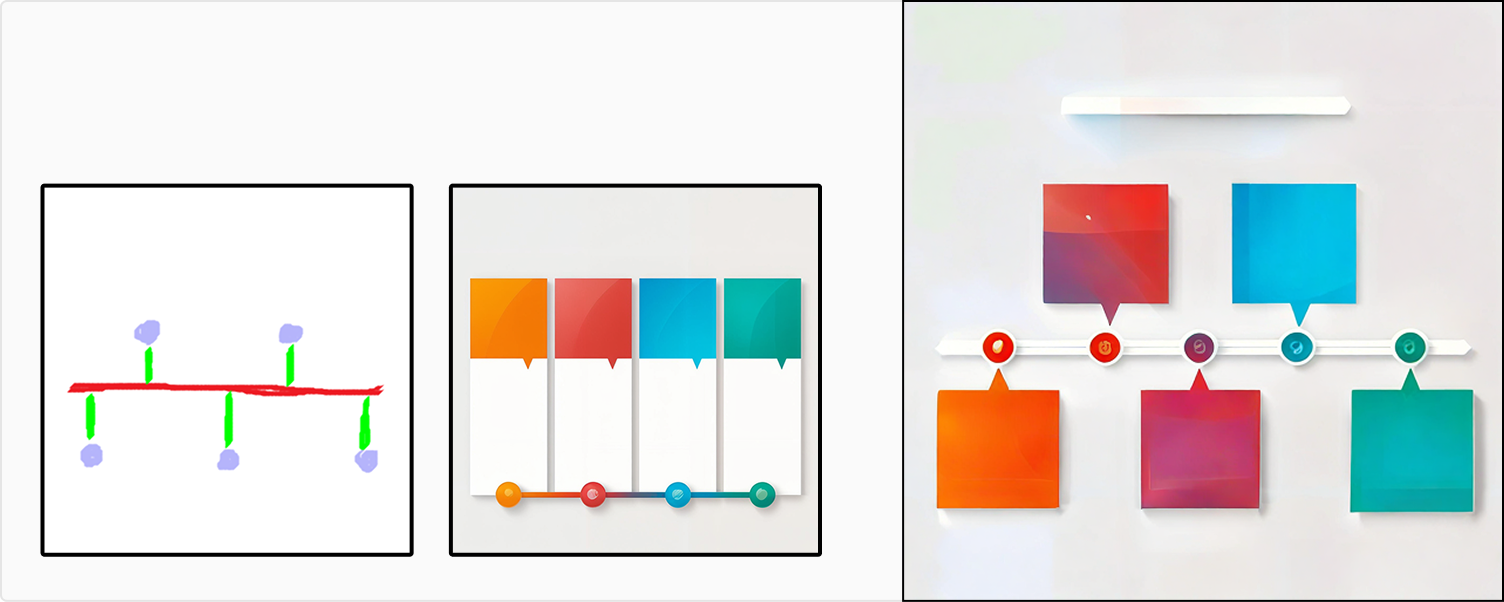
Problem: Many controllable generative models exist—which one works best for infographics?
We explore various control strategies (e.g., ControlNet, Readout) conditioned on our graph structure.
Problem: Existing style transfer models focus on global coherence, but infographic design requires element-wise correspondence for better readability and compositional clarity.